Create a Pie Chart or a Doughnut Chart in PowerPoint in Java
Pie charts and doughnut charts are two similar charts used to show the relative proportions of the whole. Both charts are great tools for visualizing data in PowerPoint presentations and can also make the documents more professional. This article will share how to add a pie chart or a donut chart to a PowerPoint slide in Java using Free Spire.Presentation for Java library.
Import Dependency
Below are two methods to install the free library.
● Download and unzip it, and then add the Spire.Presentation.jar file to your project as a dependency.
● Directly add the jar dependency to your maven project by adding the following configurations to the pom.xml.
<repositories>
    <repository>
        <id>com.e-iceblue</id>
        <name>e-iceblue</name>
        <url>https://repo.e-iceblue.com/nexus/content/groups/public/</url>
    </repository>
</repositories>
<dependencies>
    <dependency>
        <groupId>e-iceblue</groupId>
        <artifactId>spire.presentation.free</artifactId>
        <version>5.1.0</version>
    </dependency>
</dependencies>
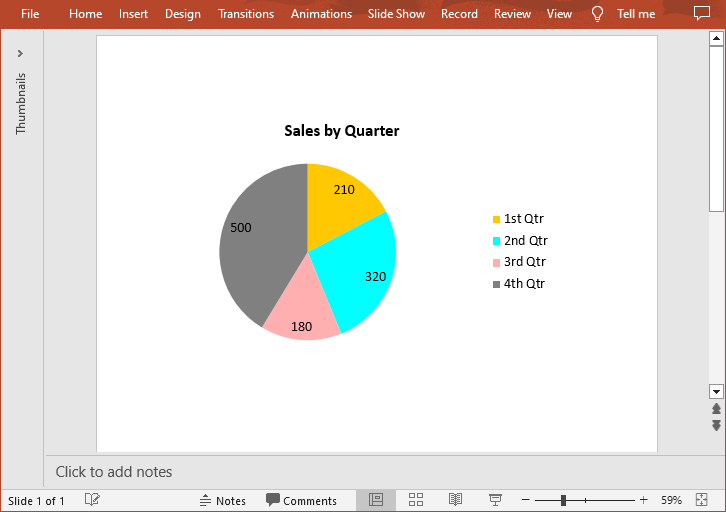
Create a Pie Chart in a PowerPoint Presentation in Java
Free Spire.Presentation for Java provides the ISlide.getShapes().appendChart(ChartType type, Rectangle2D rectangle, boolean init) method to add a certain type of chart to a specified presentation slide. Below is the complete sample code for adding a pie chart in PowerPoint.
import com.spire.presentation.*;
import com.spire.presentation.charts.*;
import com.spire.presentation.charts.entity.*;
import com.spire.presentation.drawing.*;
import java.awt.*;
import java.awt.geom.Rectangle2D;

public class createPieChart {
    public static void main(String[] args) throws Exception {

        //Create a Presentation object
        Presentation presentation = new Presentation();

        //Insert a Pie chart to the first slide and set the chart title
        Rectangle2D rect1 = new Rectangle2D.Double(40, 100, 550, 320);
        IChart chart = presentation.getSlides().get(0).getShapes().appendChart(ChartType.PIE, rect1, false);
        chart.getChartTitle().getTextProperties().setText("Sales by Quarter");
        chart.getChartTitle().getTextProperties().isCentered(true);
        chart.getChartTitle().setHeight(30);
        chart.hasTitle(true);

        //Set the chart data
        String[] quarters = new String[] { "1st Qtr", "2nd Qtr", "3rd Qtr", "4th Qtr" };
        int[] sales = new int[] { 210, 320, 180, 500 };

        //Append data to ChartData, which represents a data table where the chart data is stored
        chart.getChartData().get(0, 0).setText("Quarters");
        chart.getChartData().get(0, 1).setText("Sales");
        for (int i = 0; i < quarters.length; ++i)
        {
            chart.getChartData().get(i + 1, 0).setValue(quarters[i]);
            chart.getChartData().get(i + 1, 1).setValue(sales[i]);
        }

        //Set category labels, series label and series data
        chart.getSeries().setSeriesLabel(chart.getChartData().get("B1", "B1"));
        chart.getCategories().setCategoryLabels(chart.getChartData().get("A2", "A5"));
        chart.getSeries().get(0).setValues(chart.getChartData().get("B2", "B5"));

        //Add data points to series and fill each data point with different color
        for (int i = 0; i < chart.getSeries().get(0).getValues().getCount(); i++)
        {
            ChartDataPoint cdp = new ChartDataPoint(chart.getSeries().get(0));
            cdp.setIndex(i);
            chart.getSeries().get(0).getDataPoints().add(cdp);
        }
        chart.getSeries().get(0).getDataPoints().get(0).getFill().setFillType( FillFormatType.SOLID);
        chart.getSeries().get(0).getDataPoints().get(0).getFill().getSolidColor().setColor(Color.ORANGE);
        chart.getSeries().get(0).getDataPoints().get(1).getFill().setFillType( FillFormatType.SOLID);
        chart.getSeries().get(0).getDataPoints().get(1).getFill().getSolidColor().setColor(Color.CYAN);
        chart.getSeries().get(0).getDataPoints().get(2).getFill().setFillType( FillFormatType.SOLID);
        chart.getSeries().get(0).getDataPoints().get(2).getFill().getSolidColor().setColor(Color.PINK);
        chart.getSeries().get(0).getDataPoints().get(3).getFill().setFillType( FillFormatType.SOLID);
        chart.getSeries().get(0).getDataPoints().get(3).getFill().getSolidColor().setColor(Color.GRAY);

        //Set the data labels to display label value
        chart.getSeries().get(0).getDataLabels().setLabelValueVisible(true);

        //Save the result document
        presentation.saveToFile("createPieChart.pptx", FileFormat.PPTX_2013);
    }
}
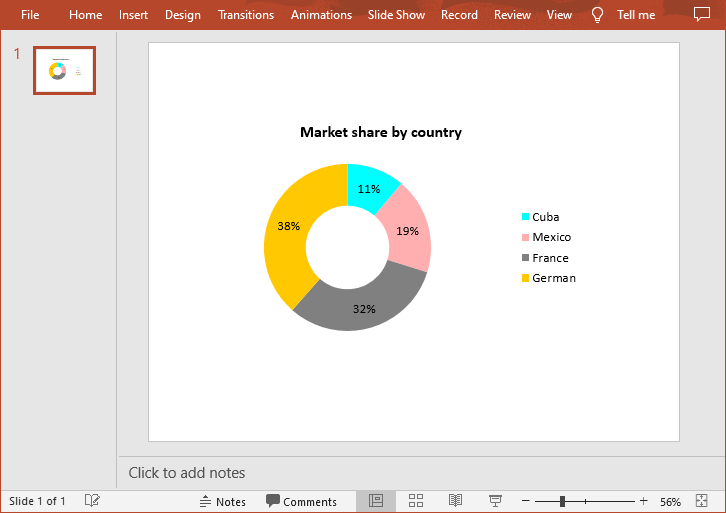
Create a Donut Chart in a PowerPoint Presentation in Java
The doughnut chart is functionally identical to pie charts except it has a circular, unfilled area in the middle of the chart. The following is the complete sample code for adding a donut chart in PowerPoint.
import com.spire.presentation.*;
import com.spire.presentation.charts.*;
import com.spire.presentation.charts.entity.*;
import com.spire.presentation.drawing.*;
import java.awt.*;
import java.awt.geom.Rectangle2D;

public class createDoughnutChart {
    public static void main(String[] args) throws Exception {
        //create a Presentation instance
        Presentation presentation = new Presentation();

        //Add a Doughnut chart to the first slide and set the chart title
        Rectangle2D rect1 = new Rectangle2D.Double(40, 100, 550, 320);
        IChart chart = presentation.getSlides().get(0).getShapes().appendChart(ChartType.DOUGHNUT, rect1, false);
        chart.getChartTitle().getTextProperties().setText("Market share by country");
        chart.getChartTitle().getTextProperties().isCentered(true);
        chart.getChartTitle().setHeight(30);

        //Set the chart data
        String[] countries = new String[]{"Cuba", "Mexico", "France", "German"};
        int[] sales = new int[]{1800, 3000, 5100, 6200};
        chart.getChartData().get(0, 0).setText("Countries");
        chart.getChartData().get(0, 1).setText("Sales");
        for (int i = 0; i < countries.length; ++i) {
            chart.getChartData().get(i + 1, 0).setValue(countries[i]);
            chart.getChartData().get(i + 1, 1).setValue(sales[i]);
        }

        //Set category labels, series label and series data
        chart.getSeries().setSeriesLabel(chart.getChartData().get("B1", "B1"));
        chart.getCategories().setCategoryLabels(chart.getChartData().get("A2", "A5"));
        chart.getSeries().get(0).setValues(chart.getChartData().get("B2", "B5"));

        //Add data points to series and fill each data point with different color
        for (int i = 0; i < chart.getSeries().get(0).getValues().getCount(); i++) {
            ChartDataPoint cdp = new ChartDataPoint(chart.getSeries().get(0));
            cdp.setIndex(i);
            chart.getSeries().get(0).getDataPoints().add(cdp);
        }
        chart.getSeries().get(0).getDataPoints().get(0).getFill().setFillType(FillFormatType.SOLID);
        chart.getSeries().get(0).getDataPoints().get(0).getFill().getSolidColor().setColor(Color.CYAN);
        chart.getSeries().get(0).getDataPoints().get(1).getFill().setFillType(FillFormatType.SOLID);
        chart.getSeries().get(0).getDataPoints().get(1).getFill().getSolidColor().setColor(Color.pink);
        chart.getSeries().get(0).getDataPoints().get(2).getFill().setFillType(FillFormatType.SOLID);
        chart.getSeries().get(0).getDataPoints().get(2).getFill().getSolidColor().setColor(Color.gray);
        chart.getSeries().get(0).getDataPoints().get(3).getFill().setFillType(FillFormatType.SOLID);
        chart.getSeries().get(0).getDataPoints().get(3).getFill().getSolidColor().setColor(Color.orange);

        //Set the data labels to display percentage value
        chart.getSeries().get(0).getDataLabels().setPercentValueVisible(true);

        //Save the result document
        presentation.saveToFile("createDoughnutChart.pptx", FileFormat.PPTX_2013);
    }
}